Title 40 CFR Part 191
Subparts B and C
Compliance Recertification Application 2014
for the
Waste Isolation Pilot Plant
Appendix HYDRO - 2014
Hydrological Investigations

United States Department of Energy
Waste Isolation Pilot Plant
Carlsbad Field Office
Carlsbad, New Mexico
Compliance Recertification Application 2014
Appendix HYDRO - 2014
Table of Contents
HYDRO - 1.0 Hydrological Studies
HYDRO - 2.0 Optimization of Culebra Monitoring Well Network
HYDRO - 3.0 Geochemical Analyses
HYDRO - 4.0 Steel-Cased Well Reconfiguration and Replacement
HYDRO - 5.0 Geological Information
HYDRO - 6.0 Hydraulic Test Interpretation
HYDRO - 7.1 Culebra Monitoring
HYDRO - 7.2 Magenta Monitoring
HYDRO - 7.3 Dewey Lake Monitoring
HYDRO - 7.4 Bell Canyon Monitoring
HYDRO - 7.5 Monitoring Summary
HYDRO - 8.0 Culebra Heads Contour Map Generation
HYDRO - 9.0 Summary and Conclusions
List of Figures
Figure HYDRO - 1. Locations of WIPP Wells and Wellpads
Figure HYDRO - 2. General Stratigraphic Column of Geologic Units at the WIPP Site
Figure HYDRO - 3. Detailed Rustler Formation Stratigraphy
Figure HYDRO - 8. Culebra Well Downhole Pressure Transducer Data Coverage
Figure HYDRO - 9. Water Levels In 7 Culebra Wells North of the WIPP Site
Figure HYDRO - 10. Water Levels In 10 Culebra Wells In the Northern Portion of the WIPP Site
Figure HYDRO - 11. Water Levels In 11 Culebra Wells In the Central WIPP Site
Figure HYDRO - 13. Water Levels In 8 Culebra Wells South of the WIPP Site
Figure HYDRO - 14. Water Levels In 7 Culebra Wells In and Near the Southeastern Arm of Nash Draw
Figure HYDRO - 16. Water Levels In Culebra Wells IMC-461 and SNL-9 West of the WIPP Site
Figure HYDRO - 18. Water Levels In Culebra Wells SNL-6 and SNL-15 East of the H2/M2 Halite Margin
Figure HYDRO - 19. Water Levels In 6 Magenta Wells
Figure HYDRO - 20. Water Levels In 5 Magenta Wells
Figure HYDRO - 21. Water Levels In Magenta Wells H-6c and H-8a
Figure HYDRO - 22. Magenta Well Downhole Pressure Transducer Data Coverage
Figure HYDRO - 23. WQSP-6A Dewey Lake Water Levels
Figure HYDRO - 24. Bell Canyon Water Levels
List of Tables
Table HYDRO - 1. Wells Plugged, Abandoned, and Reconfigured, 2008-2012
Acronyms and Abbreviations
AMSL above mean sea level
AP analysis plan
ASER Annual Site Environmental Report
CB Cabin Baby
CFR Code of Federal Regulations
cm centimeter
CRA Compliance Recertification Application
DOE U.S. Department of Energy
EPA U.S. Environmental Protection Agency
LWB Land Withdrawal Boundary
m meter
m2/s square meters per second
PA performance assessment
PABC Performance Assessment Baseline Calculation
P&A plugging and abandonment
Sc composite score
SNL Sandia National Laboratories
TP test plan
USGS U.S. Geological Survey
WIPP Waste Isolation Pilot Plant
WQSP Water Quality Sampling Program
HYDRO - 1.0 Hydrological Studies
This appendix provides a summary of the new information on Waste Isolation Pilot Plant (WIPP) hydrology collected since 2008 (the data cutoff for the 2009 Compliance Recertification Application [CRA-2009]), in accordance with the requirements of 40 CFR § 194.15 (U.S. EPA 1996). Over that period, the U.S. Department of Energy (DOE) collected new information on WIPP hydrogeology as a result of ongoing monitoring programs.
Section HYDRO-2.0 describes an updated modeling study used to optimize the number and locations of wells in the Culebra monitoring network. Section HYDRO-3.0 describes a comprehensive geochemical study of the groundwater found in geologic units above the Salado Formation. Section HYDRO-4.0 lists wells replaced or plugged and abandoned since the CRA-2009. Section HYDRO-5.0 discusses geologic information collected since CRA-2009 in the WIPP monitoring network. Section HYDRO-6.0 lists hydraulic pumping and slug test analyses performed on wells in the WIPP monitoring network. Section HYDRO-7.0 describes the water level monitoring performed since the CRA-2009 and the changes in water levels that have been observed. Section HYDRO-8.0 discusses the generation of piezometric surface maps using the Culebra groundwater model discussed in Appendix TFIELD-2014. Section HYDRO-9.0 provides an integration of all the new hydrological information collected since the CRA-2009.
For general reference, Figure HYDRO-1 provides a map showing the locations of all wells discussed in this appendix. Figure HYDRO-2 and Figure HYDRO - 3 are stratigraphic columns showing the geologic units discussed below.
Figure HYDRO - 1. Locations of WIPP Wells and Wellpads
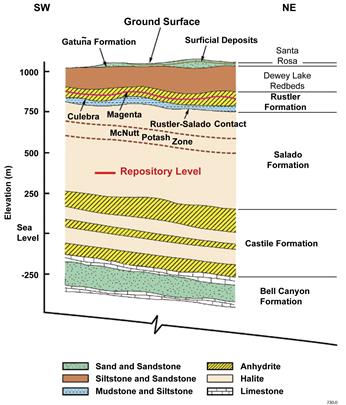
Figure HYDRO - 2. General Stratigraphic Column of Geologic Units at the WIPP Site
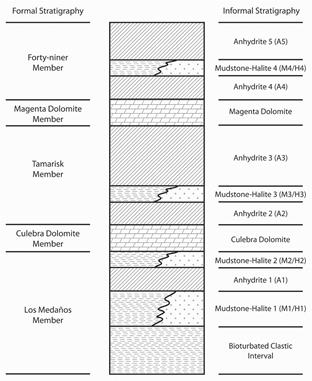
Figure HYDRO - 3. Detailed Rustler Formation Stratigraphy
HYDRO - 2.0 Optimization of Culebra Monitoring Well Network
Kuhlman (Kuhlman 2010a) revised a well-network minimization and optimization study initially performed by McKenna (McKenna 2004) under analysis plan (AP) 111, Analysis Plan for Optimization and Minimization of the Culebra Monitoring Network for the WIPP, developed by Beauheim and McKenna (Beauheim and McKenna 2003). The results of this optimization study are used programmatically to provide a more quantitative measure of relative importance of steel-cased monitoring wells to the long-term Culebra monitoring network. This study used the 100 input parameter fields (i.e., transmissivity or T fields) developed for the CRA-2009 Performance Assessment Baseline Calculation (PABC) to identify the locations where head and transmissivity data from new wells might cause the greatest uncertainty reduction. Uncertainty changes are associated with calculating groundwater travel times in the Culebra Member of the Rustler Formation from a point above the center of the WIPP disposal panels to the WIPP Land Withdrawal Boundary (LWB). Kuhlman (Kuhlman 2010a) used three different methods to determine the value of an existing well or potential well location. The three metrics were combined to create maps showing the relative value of additional head data at points throughout the modeling domain. The three metrics used include:
1. reduction of freshwater head kriging variance,
2. optimization of the shape of triangles drawn between the wells for estimating head gradients (i.e., equilateral triangles are better than obtuse triangles), and
3. identification of areas where more head data in the model (i.e., from a new Culebra monitoring well) would likely have the largest positive impact on constraining model-predicted travel times.
These three different monitoring network assessment approaches are combined to rank:
1. possible locations for new wells, and
2. importance of replacement (rather than simple abandonment) for existing steel-cased well locations.
Figure HYDRO-4 (reproduced from Kuhlman 2010a) shows spatial distribution of the composite score (Sc), which is the sum of the three metrics (each ranging from -1 to 1). Orange areas are poor-quality locations for a new Culebra monitoring well, while dark blue areas are good potential locations for a new Culebra monitoring point. Areas between monitoring locations distant from the WIPP LWB (black square) have high rank (dark blue), because they reduce kriging variance between distal wells and they improve the aspect ratio of triangles made between observation locations (a typical way to estimate hydraulic head gradients - more uniform triangles are better than elongated triangles). Several areas roughly consisting of "spokes" radiating away from the WIPP LWB - along lines of monitoring wells - rank more poorly overall (yellow and orange). The areas within the WIPP LWB mostly have Sc > 0, because model-predicted heads at these locations are more highly correlated with model-predicted travel times within the WIPP LWB.
The same three metrics were used to rank locations of existing steel-cased wells, assuming fiberglass-cased wells will have a long life, since most steel-cased wells are currently near the end of their useful life. In Figure HYDRO - 5 (reproduced from Kuhlman 2010a), symbol size is related to relative importance of each of the steel-cased wells, ranked via the three metrics. Many wells are important to one or two metrics and unimportant to another (e.g., closely spaced wells inside the WIPP LWB perform poorly in the kriging variance reduction, but might be in important areas for the model output correlation). Overall, wells H-12, H-11b4, and AEC-7 have relatively high ranks in all three metrics, while other wells distant from the WIPP LWB have relatively high ranks in at least two of the three metrics (e.g., H-9c, H-10c, USGS-4). These wells are somewhat isolated and therefore are individually important in their contributions to the success of the overall monitoring network.
Figure HYDRO - 4. Combined Network Optimization Score for New Culebra Well Locations. Red dots are steel-cased wells and green squares are fiberglass-cased wells. Dashed lines represent Salado dissolution (blue), M3/H3 halite margin (red), and M2/H2 halite margin (green).
Since the Kuhlman (Kuhlman 2010a) report was prepared, WIPP-25 has been plugged and abandoned (without replacement), and wells H-9c, H-4b, and H-11b4 have been plugged and replaced with fiberglass-cased monitoring wells. The condition of individual steel wells, as observed with downhole video monitoring, is a significant factor in the selection of replacement wells; the results of this optimization study are considered as an additional source of information for decision making. Section HYDRO-4.0 includes more discussion about recent well drilling and plugging activities, including discussion of well recompletion activities occurring before the Kuhlman (Kuhlman 2010a) report, which are already incorporated into it (e.g., WIPP-30, H-6R and H-15R).
Figure HYDRO - 5. Ranking of Steel-cased Well Locations with Three Metrics. Each of the red, green and blue symbol sizes corresponds to the relative rank of the metric at that well. The green curve is the active portion of the CRA-2009 PABC Culebra groundwater flow model; the black square is the WIPP LWB.
HYDRO - 3.0 Geochemical Analyses
Domski et al. (Domski et al. 2011) presented geochemical analysis of waters from WIPP wells completed above the Salado, focusing on groundwaters from the Rustler Formation, the Dewey Lake Redbeds Formation, and the Santa Rosa Formation. The study only included samples from the Culebra Dolomite Member of the Rustler Formation where new or historic samples were found, which were not included in the previous Culebra-specific geochemical study of Domski and Beauheim (Domski and Beauheim 2008).
Domski et al. (Domski et al. 2011) used similar methodology as Domski and Beauheim (Domski and Beauheim 2008), utilizing geochemical modeling and facies categorization based upon the chemical species observed in water quality samples. The spatial coverage of wells in these other formations is much less than well coverage in the Culebra, making it difficult to draw conclusions regarding the spatial distribution of geochemical facies, as was done for the Culebra in Domski and Beauheim (Domski and Beauheim 2008).
Samples from the Dewey Lake Formation generally had low ionic strength and had more significant sulfatic weathering components, related to the presence of gypsum-filled fractures in the Dewey Lake. Samples from Santa Rosa Formation wells were consistent with waters of meteoric origin, consistent with their relatively shallow occurrence.
Samples from the Magenta Member of the Rustler Formation generally were from the diagenetic facies in eastern wells near the Rustler mudstone-halite margins. Furthest to the west, Magenta wells belonged exclusively to the sulfatic weather facies. Wells centrally located within the WIPP site boundaries are likely the product of mixing between the sulfatic weathering composition to the west and the diagenetic waters in the east. Samples used in Domski et al. (Domski et al. 2011) from the Culebra Member of the Rustler were mostly from the southeastern arm of Nash Draw and in replacement wells drilled recently at the WIPP site. More recent and historic Culebra water quality analyses generally agreed with Domski and Beauhiem (Domski and Beauheim 2008), adding detail to the distribution of facies in the southeastern arm of Nash Draw. Samples from the Rustler-Salado contact are in general quite briney. East of Nash Draw, the formation contains magnesium-rich brines, which are believed to be diagenetic in origin, while wells in and closer to Nash Draw show effects of halite dissolution in the underlying Salado Formation.
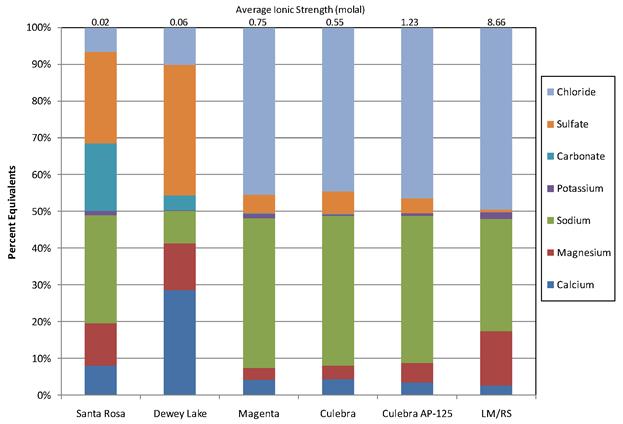
Figure HYDRO - 6. Average Water Composition and Ionic Strength for Water Quality Samples Taken From Geologic Units Above the Salado Formation. LM/RS indicates the Los Medaños or Rustler-Salado contact formation.
Figure HYDRO-6 (reproduced from Domski et al. 2011) shows the average composition of water quality samples collected above the Salado Formation. The "Culebra" bar is the average composition for the few Culebra samples in Domski et al. (Domski et al. 2011), while the "Culebra AP-125" bar represents the average of a much larger sample taken from Domski and Beauheim (Domski and Beauheim 2008). This figure clearly summarizes the difference in composition between samples collected from the Santa Rosa and Dewey Lake Formations, compared to samples from the Rustler Formation. Magenta compositions are very similar to Culebra compositions. Culebra average ionic strength is greater in the larger, more representative AP-125 dataset compared to the smaller dataset analyzed by Domski et al. (Domski et al. 2011).
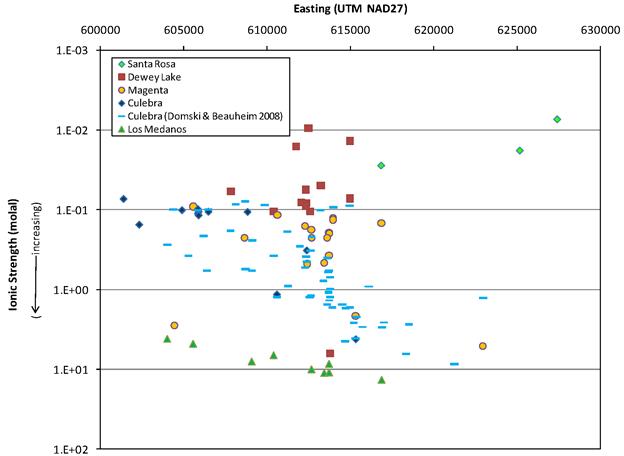
Figure HYDRO - 7. Ionic Strength Versus UTM Easting Coordinate for Water Quality Samples From All Wells Above the Salado Formation
Figure HYDRO - 7 (reproduced from Domski et al. 2011) summarizes the relationship between ionic strength, geologic formation, and east-west location of wells completed above the Salado Formation at the WIPP. Ionic strength varies across more than three orders of magnitude between the Santa Rosa and the Los Medaños Member of the Rustler Formation. Regional groundwater chemistry undergoes radical changes over relatively short vertical distances, driven largely by proximity to the Salado Formation. In the Rustler Formation, waters tend to increase in ionic strength to the east, related to proximity to the mudstone-halite margins within the Rustler Formation (Domski and Beauheim 2008). Santa Rosa and Dewey Lake waters do not appear to follow a similar trend of increasing ionic strength to the east, likely related to their more direct vertical recharge path from precipitation (Domski et al. 2011). The sole Dewey Lake sample with high ionic strength is associated with potash mine tailings contamination (SNL-1), and is not representative of the Dewey Lake Formation in general.
Geochemical analysis of groundwater samples collected from formations above the Salado (Domski et al. 2011) agrees with previous analyses conducted on the Culebra (Domski and Beauheim 2008). These studies reveal how the geochemistry of the Culebra and Magenta fit into regional groundwater trends both vertically and horizontally. This information is supportive of the general conceptual model for groundwater recharge of shallow formations near the WIPP.
HYDRO - 4.0 Steel-Cased Well Reconfiguration and Replacement
From the 1970s through 1994, all WIPP-constructed wells used steel well casing. Exposure to brine caused the steel casings to deteriorate, necessitating the plugging and abandonment (P&A) of many wells. During the peak of testing in the Culebra, many well pads had multiple Culebra wells within 50 meters (m) of one another. The cost to maintain such a density of monitoring locations is not justified based solely on the network's use for long-term monitoring. Previously, a large number of Culebra wells located on the same wellpad were plugged and abandoned. The current Culebra monitoring network is considered to have sufficient spatial coverage, and will be sustained for long-term Culebra monitoring. As the remaining steel-cased monitoring wells fail, they will be replaced with suitable fiberglass-reinforced, plastic-cased (or equivalent) wells.
Since 2008, two steel-cased wells have been plugged and abandoned without replacement (WIPP-25 and WIPP-30, see Table HYDRO - 1). AEC-7 was reperforated across the Culebra in 2008 (U.S. DOE 2009a and U.S. DOE 2009c). Three multiple-completion wells have been permanently recompleted to monitor individual formations (H-15, H-16 and H-9c). H-9c was redrilled in 2010; its replacement is named H-9bR. Five replacement wells were drilled and completed with fiberglass-reinfored plastic casings (H-6bR, H-15R, H-4bR, H-9bR, and H-11b4R). In H-series wells up to H-11 (drilled by the U.S. Geological Survey in the 1970s), a, b, and c suffixes originally referred to Magenta, Culebra, and Rustler-Salado contact completions, respectively.
| Well | Interval(s) Previously Monitored | Activity | Date of Activity | Current Interval Monitored |
|---|---|---|---|---|
| WIPP-30 | Culebra and Magenta | Plugged and abandoned | February 2008 | - |
| H-6b | Culebra | Plugged and abandoned, Culebra well replaced by H-6bR | February 2008 | - |
| AEC-7 | Culebra | Scraped and reperforated | March 2008 | Culebra |
| H-15 | Culebra and Magenta | Plugback and reconfigured, Cuelbra well replaced by H-15R | March 2008 | Magenta |
| H-16 | Forty-niner, Magenta, Tamarisk, Culebra, and Los Medaños | Reconfigured from multicompletion open-hole Rustler to screened Culebra | July 2008 | Culebra |
| WIPP-25 | Culebra and Magenta | Plugged and abandoned | June 2009 | - |
| H-4b | Culebra | Plugged and abandoned, Culebra well replaced by H-4bR | July 2009 | - |
| H-9c | Culebra and Magenta | Plugback, Culebra well replaced by H-9bR | September 2010 | Magenta |
| H-11b4 | Culebra | Plugged and abandoned, Culebra well replaced by H-11b4R | November 2011 | - |
HYDRO - 5.0 Geological Information
In the previous five-year period (2003-2008), a significant number of new monitoring wells were drilled, greatly expanding and supporting the geologic understanding of the Rustler Formation. In the period 2008-2012, no new monitoring well locations were drilled to obtain new geologic information, but replacement wells were drilled on existing well pads (Table HYDRO - 1). This type of activity does not typically produce new geologic information, but any cuttings and geophysical logs obtained do confirm our geologic conceptual model of the Rustler Formation.
From December 2010 to January 2011, two potash exploration boreholes (MOS-20 and MOS-21) were drilled to the McNutt Potash zone by Mosaic Potash in T22S R31E sections 9 and 10. Sandia National Laboratories (SNL) logged the cuttings of both wells through the Rustler Formation, and also geophysically logged borehole MOS-21 (Schuhen 2011). Both boreholes encountered the Gatuña Formation, but only the eastern MOS-21 borehole (in section 10) encountered a section of the Santa Rosa Formation, located stratigraphically between the Gatuña and Dewey Lake Formations.
These boreholes were plugged and abandoned after Mosaic collected their cores across the potash ore zones. The boreholes provided additional confirmatory information related to the geologic units above the Salado Formation.
HYDRO - 6.0 Hydraulic Test Interpretation
Hydraulic testing at the WIPP is carried out under Test Plan (TP) 03-01 (Schuhen 2010a), while interpretation of hydraulic tests conducted at the WIPP is carried out under the Analysis Plan AP-070 (Beauheim 2009). Two summary interpretive reports on hydraulic property parameter estimates from hydraulic tests in Culebra and Magenta wells were recently issued. This section only discusses hydraulic tests recently analyzed; some of the Magenta tests were performed in the 1970s, but have been interpreted or re-interpreted recently.
Bowman and Roberts (Bowman and Roberts 2009) analyzed two Culebra slug tests (SNL-6 and IMC-461), a Magenta slug test (C-2737), and two low-flowrate Magenta pumping tests (H-11b2 and H-15). The slug and pumping tests were conducted between January 2005 and August 2008. The results of the analysis provided estimates of Culebra transmissivity (i.e., the product of formation hydraulic conductivity and formation thickness). The IMC-461 transmissivity estimate (1.92×10⁻⁴ square meters per second [m2/s]) was used as supporting data in the calibration of the CRA-2009 PABC Culebra groundwater flow model, and the very low SNL-6 transmissivity value (8.72×10⁻¹² m2/s) was used in part to characterize the portion of the Culebra east of the H2/M2 and H3/M3 halite margins, where halite cements are present in the Culebra. The estimated Magenta transmissivity values were all within an order of magnitude of each other: from a minimum of 1.11×10⁻⁷ m2/s in the C-2737 injection test to a maximum of 9.50×10⁻⁷ m2/s at H-15.
Bowman and Beauheim (Bowman and Beauheim 2010) interpreted transmissivity estimates for 15 pumping and slug tests conducted in the Magenta between 1978 and 2009. Slug injection and withdrawal tests were conducted in DOE-2, H-2a, H-3b1, H-4a, H-5a, H-6a, H-8a, H-9a, H-10a, H-14, H-16, WIPP-18, WIPP-27, and WIPP-30. A low-flowrate pumping test was conducted in H-18. The results included a very high far-field transmissivity value of 3.96×10⁻² m2/s at WIPP-27, in Nash Draw, where the Magenta is very shallow. Aside from this extremely high estimate, transmissivity values in the Magenta ranged across nearly three orders of magnitude, from a minimum of 1.80×10⁻⁹ m2/s at DOE-2 to 9.70×10⁻⁷ m2/s at H-9a.
HYDRO - 7.0 Monitoring
Groundwater monitoring activities at the WIPP are carried out under the Waste Isolation Pilot Plant Environmental Monitoring Plan (U.S. DOE 2004) and under Test Plan TP 06-01, Monitoring Water Levels in WIPP Wells, Revision 3 (Schuhen 2010b). The first monitoring program consists of monthly water-level measurements in all accessible wells, with results reported in the Annual Site Environmental Reports (ASERs) (U.S. DOE 2008, U.S. DOE 2009c, U.S. DOE 2010, U.S. DOE 2011 and U.S. DOE 2012). The second monitoring program involves both periodic water-level measurements and continuous measurement (typically at 1-hour intervals) of fluid pressure in wells instrumented with downhole pressure gauges.
Water-level monitoring provides a general picture of the changes in hydraulic head occurring in the formations being monitored. Water levels are currently being monitored in the Culebra and Magenta Members of the Rustler Formation, the Dewey Lake (Redbeds) Formation, and the Bell Canyon Formation. The monitored well locations are shown in Figure HYDRO-1. Reconfigured or plugged and abandoned wells are listed in Table HYDRO-1.
HYDRO - 7.1 Culebra Monitoring
In addition to monitoring Culebra water levels, the DOE monitors the fluid pressure in many wells with downhole pressure transducers. The history of Culebra wells instrumented with downhole pressure transducers is given in Figure HYDRO - 8. This figure shows the periods of time from January 2003 to the present during which pressure transducers were installed in Culebra wells. The continuous fluid-pressure measurements made using pressure transducers provide a clearer, more complete record of the changes in hydraulic head occurring in the wells than is provided by monthly water-level measurements alone. Currently, 38 Culebra wells are monitored with downhole pressure transducers. Of the wells that were monitored at one time, 7 wells had been monitored before having their Culebra completions plugged and abandoned (CB-1, DOE-1, P-17, WIPP-12, WIPP-25, WIPP-26, and WIPP-30), 5 wells shifted monitoring to a replacement well upon re-drilling (H-4b, H-6b, H-9c, H-11b4, and H-15), and 7 wells were only monitored on a temporary basis for testing purposes (H-8b, H-19b2, USGS-4, WQSP-1, WQSP-2, WQSP-3, and Engle - a privately owned windmill approximately 1 kilometer southeast of H-9).
Groundwater density calculations are carried out under Activity/Project Specific Procedure SP 9-11, Calculation of Densities for Groundwater in WIPP Wells (Johnson 2012a). Pressure transducers are installed at midformation, which allows the combination of observed pressure, installation depth, and water level elevation measurements to yield an estimate of fluid density. Culebra groundwater density varies from nearly fresh in the southeastern arm of Nash Draw (e.g., H-7b1), to nearly saturated with respect to halite in wells SNL-6 and SNL-15. This procedure has been applied to both current years and historical data to produce estimates of fluid densities in wells from 2003 through 2012, although coverage was minimal in early years (Johnson 2010, Johnson 2011, Johnson 2012b, Johnson 2012c, Johnson 2012d, Johnson 2012e, and Johnson 2012f). This approach was also used to compute 2007 Culebra groundwater densities to estimate freshwater heads required for the calibration of the Culebra groundwater flow model for CRA-2009 PABC (Johnson 2008 and Johnson 2009).
The high-resolution pressure transducer data have shown that wells near Nash Draw respond rapidly to large rainfall events, with more muted and delayed responses to rainfall in wells further to the east of Nash Draw (Hillesheim et al. 2007). Thus, the Culebra appears to be unconfined in at least parts of Nash Draw, probably because of a combination of dissolution, collapse, and fracturing of the overlying units that act as confining beds under Livingston Ridge. This is not to say, however, that present-day rainfall actually enters the Culebra wherever a pressure response to rainfall is observed. Rather, the rainfall reaches a water table in a higher stratigraphic unit that is in sufficient hydraulic communication with the Culebra to transmit a pressure response rapidly. It takes a much longer time for water or dissolved constituents to move through the subsurface than it takes a pressure wave to propagate through a saturated porous medium.
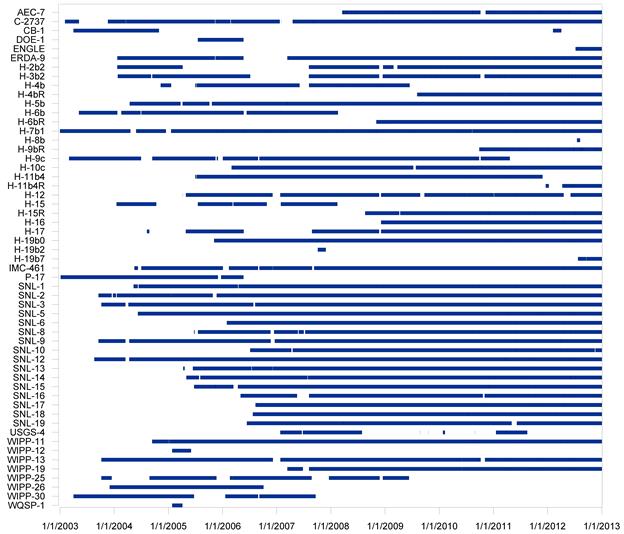
Figure HYDRO - 8. Culebra Well Downhole Pressure Transducer Data Coverage
Figure HYDRO - 9 through Figure HYDRO - 16 and Figure HYDRO - 18 show manual water levels from almost all Culebra wells monitored by the WIPP for the period from 2006 through 2012. Refer to Figure HYDRO-1 for well locations. Wells are grouped together roughly by geographic locality, including consideration to keep together wells with similar temporal behavior or water level elevations. The reporting period for Culebra wells in this subsection was chosen to start in 2006 (rather than 2008) to clearly show the current stable or declining water levels in the context of the end of the long-term rise observed in most WIPP wells (which approximately ended in 2008).
Water levels observed in May 2007 were used along with observed responses to large-scale pumping tests as calibration targets for calibration of the Culebra groundwater flow models used in the WIPP Performance Assessment (PA) for the CRA-2009 PABC (see Appendix TFIELD-2014). May 2007 was near the peak of water levels observed to date at the WIPP site; water levels have remained relatively stable with slight declines observed since this time. Water levels in most Culebra wells roughly move up and down together. The water level "snapshot" chosen in 2007 as a steady-state calibration target for the Culebra PA model can be still considered representative of conditions at the WIPP.
Figure HYDRO - 9 and Figure HYDRO - 10 show water levels from wells north of the WIPP site and in the northern portion of the WIPP site. The water level trends from these 17 wells generally parallel one another. The seven wells in Figure HYDRO-9 generally respond together, with a peak water level elevation observed in late 2006 (SNL-2 and SNL-19) or late 2007 (SNL-5 and WIPP-11). After this peak, water levels in these seven wells have been declining slowly or leveling off, with a minor rise in 2010 followed by a more rapid decline in water levels, possibly related to low precipitation in 2011 (monthly precipitation data for the Carlsbad Airport from the National Oceanic and Atmospheric Administration National Climate Data Center). Responses observed in SNL-2 and SNL-19 appear to precede those in other wells, in which responses tend to be delayed and comparatively muted.
Figure HYDRO - 9. Water Levels In 7 Culebra Wells North of the WIPP Site
Figure HYDRO - 10. Water Levels In 10 Culebra Wells In the Northern Portion of the WIPP Site
The water level elevations plotted in Figure HYDRO - 10 show similar, but more subdued trends to those in Figure HYDRO-9. Wells AEC-7 and H-5b do not noticeably fluctuate as do Culebra wells to their north and west. Well AEC-7 water levels before the reperforation event in early 2008 were not representative of the Culebra and are not plotted. Water levels were affected by water quality sampling performed in AEC-7 from March to June 2008 (U.S. DOE 2009c). The downward shift in H-2b2 water levels in early 2009 was the result of sampling activities, which removed fresh water present in the well since scraping and plugging and abandonment activities on the well pad in 2005 (U.S. DOE 2010). Well H-6b was replaced by H-6bR in 2008; Figure HYDRO-10 shows an open symbol for the replacement well, and a filled symbol for the historic well.
Figure HYDRO - 11. Water Levels In 11 Culebra Wells In the Central WIPP Site
Figure HYDRO - 11 shows water levels from 11 Culebra wells in the central portion of the WIPP site. The water level trends in these wells mostly parallel one another, with the exception of SNL-8 and H-16. Water levels in SNL-8 changed significantly after pumping and sampling activities in 2007, which removed fresher water from the wellbore. Well SNL-8 is experiencing a slight increase in water levels since 2011; H-5b is also experiencing an increase during this period (Figure HYDRO-10). The step change in water levels in C-2737 from 2007 to 2008 was similarly due to density effects related to fresh water left in the packer, which was installed to allow simultaneous monitoring of the Culebra and Magenta (U.S. DOE 2008 and U.S. DOE 2009c). Since recompletion, H-16 has observed annual fluctuations, which are believed to be related to the well's proximity to the air intake shaft, less than 15 m away. Although the fluctuations appear to consistently occur during winter months, the character of the drops is not consistent between years (Figure HYDRO-12), with the drop in 2011 being much more asymmetric than 2010 or 2012. Figure HYDRO-12 illustrates the usefulness of high-frequency pressure transducer data to confirm possible outliers in the water level data series (e.g., the low water level elevations measured in January 2010 or February 2011), and to catch transient extremes missed by monthly observations (e.g., the lowest pressure observed in December 2011).
Figure HYDRO - 12. Water Levels (Symbols) and Pressure Transducer Data (Continuous Line) for Recompleted Culebra Well H-16 Near the WIPP Air Intake Shaft
Water level fluctuations observed in central wells were generally smaller than those observed in northern wells (i.e., wells in Figure HYDRO - 9 and Figure HYDRO - 10). Central wells also have maximum water levels in approximately mid-2008, followed by a very gradual decline in water level. Some wells respond to the semi-annual pumping in the WIPP Water Quality Sampling Program (WQSP) wells (e.g., H-19b0 and H-3b2). In 2012, the frequency of sampling has been reduced from semi-annual to annual. The effects of a 72-hour development pumping event in June 2012 were observed in some locations (the vertical line in Figure HYDRO - 11 corresponds to the pumping duration at H-11b4R). Water levels from H-15R are plotted, but H-15 water levels are not plotted, as the latter are not believed to be representative of the Culebra. H-15 was a dual-completion well (Magenta and Culebra) that was disrupted by removing or replacing bridge plugs and production-injection packers for a variety of testing and water-quality sampling exercises.
Figure HYDRO - 13 shows water levels in wells located south and southeast of the WIPP site. There are no large fluctuations in water levels in this area, aside from the large change in water levels at H-10c in July 2009. This change was related to removal of fresh water left over from well perforation activities in 2002 (U.S. DOE 2010). These wells only show a very slight rise and fall, similar in shape but lesser in magnitude to Culebra wells to the north, but they have been gradually declining since 2009 or 2010. Well H-4bR replaced H-4b in 2009 and H-11b4R replaced H-11b4 in 2011.
Figure HYDRO - 13. Water Levels In 8 Culebra Wells South of the WIPP Site
Figure HYDRO - 14 shows water level time series in wells south and southwest of the WIPP site, near the southeastern arm of Nash Draw. The Culebra produces fresher water in this area, which is sometimes used for livestock watering. Some sustained pumping appears to have occurred near H-9c in the latter part of 2006, seen most clearly in the H-9c hydrograph but also recognizable in the hydrographs from SNL-12 (Figure HYDRO - 14) and H-17, H-11b4, and H-4b (Figure HYDRO - 13). This pumping may have been related to either livestock watering or oil and gas well drilling support activities. Most wells in the southeastern arm of Nash Draw have been gradually declining since 2008 or 2009. SNL-16 has a similar response to precipitation events as seen in Culebra wells north of the WIPP site.
Figure HYDRO - 14. Water Levels In 7 Culebra Wells In and Near the Southeastern Arm of Nash Draw
SNL-13 has seen large fluctuations since a rise in 2010 attributed to oil and gas drilling in its vicinity. Figure HYDRO - 15 shows both water levels and pressure transducer readings, along with spud dates obtained from the New Mexico Oil Conservation Division well search application for three sections surrounding SNL-13, T22S R30E Section 36, T23S R30E Section 1, and T23S R31E Section 6 (some wells in these sections did not have reported spud dates). In February 2012 an oilfield truck struck and became stuck on the SNL-13 surface casing, requiring the surface casing to be repaired (see the drop in pressure just after last peak in pressure transducer data shown in Figure HYDRO - 15). The water levels and pressure transducer observations at SNL-13 appear to show effects of a longer-term slow rise and decay, beginning in early 2010, along with shorter-term rapid rises and decays through 2011 and 2012, some of which correspond closely to reported spud dates of nearby oil and gas wells. Neither the short- or long-term rises are observable in nearby Culebra wells SNL-17 (Figure HYDRO - 14) or H-4bR (Figure HYDRO - 13).
Figure HYDRO - 15. Water Levels (Symbols) and Pressure Transducer Data (Continuous Line) for Culebra Well SNL-13, with Spud Dates of Nearby Oil Wells (Vertical Lines).
Figure HYDRO - 16 shows water level time series from Culebra wells SNL-9 and IMC-461 west of the WIPP site. The major upturns in water levels represent delayed responses to major rainfall events. Since peak water levels in 2006, water levels have generally been declining and following similar trends to wells north and west of the WIPP site (e.g., SNL-2 and SNL-19 in Figure HYDRO - 9). Well IMC-461 had a significant shift in water level in March 2012 due to a collapse in a nearby potash mine.
Figure HYDRO - 16. Water Levels In Culebra Wells IMC-461 and SNL-9 West of the WIPP Site
Figure HYDRO - 17 shows the observed response of downhole pressure transducers in two Culebra wells to a significant roof collapse in a potash mine located in nearby Nash Draw. The collapse was registered in the U.S. Geological Survey (USGS) National Earthquake Information Center Database as a magnitude 3.1 event, occurring at 3:57:22 AM on March 18, 2012 (plotted as a vertical line in the close up portion of Figure HYDRO - 17). The upper plot in this figure shows the stability of the pressure observations both before and after the event, and clearly supports the observed shift in monthly water levels (see Figure HYDRO - 14 and Figure HYDRO - 16). Small-scale fluctuations in downhole pressure readings are due to effects of barometric pressure changes and Earth tides, which have a larger effect on IMC-461 than on SNL-16, possibly due to the different wellbore diameters. IMC-461 is completed using a 5.3-centimeter (cm) inner diameter schedule 80 polyvinyl chloride casing, while SNL-16 is completed using 12.3-cm inner diameter fiberglass-reinforced plastic casing (Powers 2009). The only transformation applied to the pressure data was a shift by the median pressure recorded over the 24-hour period before the event, to allow plotting of both wells on the same vertical pressure scale. Other Culebra or Magenta wells did not clearly respond immediately to the event, including nearby SNL-9.
Figure HYDRO - 17. SNL-16 and IMC-461 Pressure Transducer Response to March 18, 2012 (3:57:22 AM MST) Potash Mine Roof Collapse
Figure HYDRO - 18 shows water levels from Culebra wells SNL-6 and SNL-15. These wells were drilled in areas where the Culebra contains halite cements, and are recovering very slowly from well-development activities, including an April 2007 slug test in SNL-15 (U.S. DOE 2008), and January 2008 sampling in SNL-6 (U.S. DOE 2009c). Even at the rates these wells are recovering from minor pumping and sampling (e.g., an approximately 100 m rise in SNL-6 over 5 years), water levels will not be representative of undisturbed Culebra conditions for many years.
Figure HYDRO - 18. Water Levels In Culebra Wells SNL-6 and SNL-15 East of the H2/M2 Halite Margin
HYDRO - 7.2 Magenta Monitoring
Magenta water levels were monitored in 13 wells during some or all of the period 2006 through 2012 (see Figure HYDRO - 1 for locations). The wells being monitored through 2012 are shown in Figure HYDRO - 19 through Figure HYDRO - 21. Water levels in many Magenta wells were significantly disrupted by sampling, purging events, or hydraulic testing during the plotted 2006 through 2012 period.
Figure HYDRO - 19 shows water levels from six Magenta wells, which indicate reasonably stable water levels, aside from recovery associated with pumping and purging events. Most wells show modest gradual increases in water level elevations over most of the 2006 through 2012 period. The gray dashed line in Figure HYDRO - 19 illustrates a rise of 1 m over seven years (0.143 m/year), which appears to roughly parallel the trend in most of these wells and may be due to a slow recovery from pumping and sampling Magenta wells.
In C-2737, two water level drops in 2006 and 2007, along with a water level shift in 2008, are due to activities related to re-seating packers and swabbing foreign water from tubing (U.S. DOE 2009c). After increasing for several years, H-9c has shown a decrease since activities on the H-9 wellpad in late 2010 associated with plugback of H-9c to a Magenta-only well and drilling the H-9bR Culebra replacement well. Two observed perturbations in H-11b2 during 2011 are related to drilling replacement Culebra well H-11b4R, which involved drilling two separate boreholes. Water quality samples were obtained from H-11b2 from January through June 2008 (U.S. DOE 2009c). Well H-3b1 was pumped for water quality sampling from April through July 2009 and WIPP-18 was sampled from June through September and December 2009 (U.S. DOE 2010). H-4c was purged for water quality sampling in August 2010 (U.S. DOE 2011).
Figure HYDRO - 19. Water Levels In 6 Magenta Wells
Figure HYDRO - 20 shows water levels in Magenta wells that experienced large-scale fluctuations. H-15 has been increasing steadily at a slope of approximately 1 m/year, with an unexplained meter-sized jump in 2010. H-15 was water-quality sampled in March 2008, after being completed as a Magenta-only well earlier in 2008 (U.S. DOE 2009c). H-18 has shown a steady rise from 2006 through 2012, but at a significantly steeper slope (approximately 0.43 m/year since 2010) than that observed in most wells in Figure HYDRO - 19. Well H-18 was water-quality sampled in February through April 2009 (U.S. DOE 2010), and H-2b1 was sampled from April 2010 through February 2011 (U.S. DOE 2011; U.S. DOE 2012). Well H-10a was bailed in March 2010 to remove fresh water in the borehole (U.S. DOE 2011), causing a significant adjustment in water levels due to the change in density. Well H-14 recovered slowly from pumping activities in 2007 and a water-quality sampling purge event in February 2009 (U.S. DOE 2010).
Figure HYDRO - 20. Water Levels In 5 Magenta Wells
Figure HYDRO - 21 shows water levels in two Magenta wells (H-6c and H-8a) with lower water levels than other Magenta wells. Well H-6c shows a drop in 2008, associated with the plugging, abandonment, and re-drilling activities on the H-6 wellpad. A recent jump in H-6c water levels may be due to nearby oilfield activities, although no similar response was observed at H-6bR in the Culebra. Well H-8a was sampled in April 2010 (U.S. DOE 2011).
Downhole pressure transducers are currently monitoring 13 Magenta wells, while 2 previously monitored Magenta wells (WIPP-25 and WIPP-30) have been plugged and abandoned (Figure HYDRO - 22). The pressure transducer data are consistent with the water-level measurements made in those wells. The transducer data provide a more complete record of pumping, water-quality sampling, and other activities in the wells than the water-level data alone.
Figure HYDRO - 21. Water Levels In Magenta Wells H-6c and H-8a
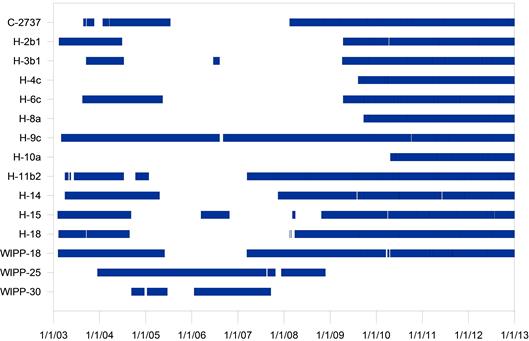
Figure HYDRO - 22. Magenta Well Downhole Pressure Transducer Data Coverage
HYDRO - 7.3 Dewey Lake Monitoring
The DOE monitors Dewey Lake water levels in one well, WQSP-6A (see Figure HYDRO - 1). Figure HYDRO - 23 shows a time series of Dewey Lake water levels in WQSP-6A from 2006 through 2012. The hydrograph shows that water levels were stable within an approximately 50-cm band over that period, with a slightly increasing downward trend. Some of the observed water level fluctuations are probably related to the water-quality sampling performed in the well twice a year, which was stopped in 2012 (WQSP sampling will no longer include WQSP-6A).
Figure HYDRO - 23. WQSP-6A Dewey Lake Water Levels
HYDRO - 7.4 Bell Canyon Monitoring
Bell Canyon monitoring wells are situated at the northern (DOE-2) and southern (Cabin Baby [CB]-1) edges of the WIPP LWB (see Figure HYDRO - 1 for well locations). The primary purpose of this monitoring is to determine if oil and gas activities in the Bell Canyon are affecting the hydraulic head of the Bell Canyon at the WIPP site. Water level elevations are plotted for the period 2003 through 2012 in Figure HYDRO - 24. This time period was chosen to clearly show the effects of well recompletion in 2004 and bailing to remove brine-contaminated water from the tubing in 2008 (U.S. DOE 2009c). Since 2004, both wells are completed exclusively to the Bell Canyon Formation and since 2008 they both contain representative Bell Canyon water in their tubing. Water levels in DOE-2 have risen slowly, but have been nearly stable since bailing activities in 2008. Water levels in CB-1 have been rising since 2008 (approximately a 6-m rise over 4.5 years), with an increase in slope near the beginning of 2011.
Both CB-1 and DOE-2 are currently monitored with downhole pressure transducers, which have been collecting data since May 2011. Pressure transducer data agree with manual water-level trends and also show clear effects of barometric fluctuations in both wells. Typically, barometric and Earth tide fluctuations are removed from pressure transducer observations using a least-squares barometric response function approach when analyzing pumping test data at the WIPP. See Toll and Rasmussen (2007) for the specific procedure and software used for this task.
Figure HYDRO - 24. Bell Canyon Water Levels
HYDRO - 7.5 Monitoring Summary
Water-level monitoring provides a general picture of the changes in hydraulic head occurring in the formations being monitored. Water levels are currently being monitored in the Culebra, Magenta, Dewey Lake, and Bell Canyon. Culebra water levels generally peaked in 2008, and fell gradually by 1 to 3 m between 2008 and 2012. Water levels fluctuated more in Nash Draw and north of the WIPP site than they did elsewhere. Water levels in most Magenta wells generally rose over the same period, by approximately 1 m (aside from a few wells rising at larger rates). The Dewey Lake water level (measured only in well WQSP-6A) was stable within a ~50-cm band over the last 5-year period. Bell Canyon water levels were stable in DOE-2 and rose steadily in CB-1 since being bailed in 2008.
In addition to monitoring water levels, fluid pressures in most Culebra, Magenta, and Bell Canyon wells are monitored on an hourly basis using downhole pressure transducers. The high-frequency fluid-pressure measurements provide a clearer, more complete record of the changes in hydraulic head occurring in the wells than that provided by monthly water-level measurements alone. The high-frequency pressure transducer data shows detailed fluctuations due to both natural (barometric, earth tides, and precipitation) and man-made (potash mine collapse and oil well drilling) stimuli.
HYDRO - 8.0 Culebra Heads Contour Map Generation
The creation of model-generated contour maps of Culebra piezometric head follows Activity/Project Specific Procedure SP 9-9, Preparation of Culebra Potentiometric Surface Contour Maps (Kuhlman 2009a). Using an averaged form of the groundwater model discussed in Appendix TFIELD, boundary conditions of the model are adjusted to better match each year's observed equivalent freshwater heads (the equivalent height of freshwater in a well, which equals the pressure exerted by the actual column of brine). Procedure SP 9-9 has been used since 2009 (Kuhlman 2009b, Kuhlman 2010b, Kuhlman 2011, and Kuhlman 2012c) to generate annual Culebra contour maps for inclusion in the WIPP ASERs (U.S. DOE 2009c, U.S. DOE 2010, U.S. DOE 2011, and U.S. DOE 2012). Culebra contour maps were also recently generated for historic data going back to 2000, to present contour maps of heads in the Culebra in a consistent manner (Kuhlman 2012a and Kuhlman 2012b).
HYDRO - 9.0 Summary and Conclusions
A Culebra monitoring-network optimization study was revised by Kuhlman (Kuhlman 2010a) to identify the locations where new Culebra monitoring wells would be of most value, and to identify wells that could be removed from the network with little loss of information. The WIPP Culebra monitoring network is now in a long-term monitoring configuration, rather than a configuration for testing. As steel-cased wells are aging and failing, they are being re-drilled and replaced with non-steel-cased wells designed for long-term stability in a saline environment.
Geochemical analysis of groundwater samples collected from formations above the Salado (Domski et al. 2011) reveals how the geochemistry of the Culebra and Magenta fit into regional groundwater trends both vertically and horizontally.
Several Culebra and Magenta slug and pumping tests were analyzed to interpret transmissivity parameter estimates at well locations. Some of the analyzed tests were conducted recently, but many of the Magenta tests were conducted historically. In the wells tested, the variability of the transmissivity of the Magenta Dolomite is less than that seen in the Culebra.
The WIPP groundwater-monitoring program has continued to augment monthly water-level measurements in wells with continuous (~hourly) fluid-pressure measurements using downhole programmable pressure gauges. Pressure transducer readings allow us to more clearly see effects of the Air Intake Shaft at H-16, nearby drilling of oil wells at SNL-13, and collapse of underlying potash mine workings (IMC-461 and SNL-16). A combination of pressure and depth-to-water measurements are used to estimate fluid density in Culebra wells at the WIPP. These densities are then used to compute equivalent freshwater heads, which are combined with an averaged version of the WIPP PA model to produce contour maps of piezometric head in the Culebra for inclusion in the WIPP ASER.
HYDRO - 10.0 References
(*Indicates a reference that has not been previously submitted.)
Beauheim, R.L., and S.A. McKenna. 2003. Analysis Plan AP-111: Analysis Plan for Optimization and Minimization of the Culebra Monitoring Network for the WIPP. ERMS 533092. Carlsbad, NM: Sandia National Laboratories. [PDF / Author]
Beauheim, R.L. 2009. Analysis Plan AP-070: Analysis Plan for Hydraulic-Test Interpretations, Revision 2. ERMS 552209. Carlsbad, NM: Sandia National Laboratories.* [PDF / Author]
Bowman, D.O., and R.L. Beauheim. 2010. Analysis Report for AP-070: Analysis of Magenta Hydraulic Tests Performed Between December 1978 and June 2009. ERMS 554590. Carlsbad, NM: Sandia National Laboratories.* [PDF / Author]
Bowman, D.O., and R.M. Roberts. 2009. Analysis Report for AP-070: Analysis of Culebra and Magenta Hydraulic Tests Performed Between January 2005 and August 2008. ERMS 550906. Carlsbad, NM: Sandia National Laboratories.* [PDF / Author]
Domski, P.S., and R.L. Beauheim. 2008. Evaluation of Culebra Brine Chemistry. AP-125. ERMS 549336. Carlsbad, NM: Sandia National Laboratories. [PDF / Author]
Domski, P.S., R.L. Beauheim, and P.B. Johnson. 2011. AP-147 Analysis Report: Evaluation of WIPP Groundwater Compositions. ERMS 556581. Carlsbad, NM: Sandia National Laboratories.* [PDF / Author]
Domski, P.S., R.L. Beauheim, and P.B. Johnson. 2007. "Mapping of Pressure-Head Responses of a Fractured Rock Aquifer to Rainfall Events." Proceedings of the 2007 U.S. EPA/NGWA Fractured Rock Conference (pp. 522-36). Westerville, OH: National Ground Water Association. [Author]
Johnson, P.B. 2008. Routine Calculations Report in Support of Task 6 of AP-114: 2007 Calculated Densities for Use in Deriving Equivalent Freshwater Heads of the Culebra Dolomite Member of the Rustler Formation near the WIPP Site, May 2007. ERMS 548127. Carlsbad, NM: Sandia National Laboratories. [PDF / Author]
Johnson, P.B. 2009. Routine Calculations Report in Support of Task 6 of AP-114: 2008 Calculated Densities for Use in Deriving Equivalent Freshwater Heads of the Culebra Dolomite Member of the Rustler Formation near the WIPP Site. ERMS 550755. Carlsbad, NM: Sandia National Laboratories.* [PDF / Author]
Johnson, P.B. 2010. Memo to Records Center (Subject: 2009 Calculated Densities). 13 January 2010. ERMS 552839. Carlsbad, NM: Sandia National Laboratories.* [PDF / Author]
Johnson, P.B. 2011. Memo to Records Center (Subject: Memo of Correction 2010 Calculated Densities). 19 January 2011. ERMS 554805. Carlsbad, NM: Sandia National Laboratories.* [PDF / Author]
Johnson, P.B. 2012a. Activity/Project Specific Procedure SP 9-11: Calculation of Densities for Groundwater in WIPP Wells, Revision 2. ERMS 558734. Carlsbad, NM: Sandia National Laboratories.* [PDF / Author]
Johnson, P.B. 2012b. Memo to Records Center (Subject: 2011 Calculated Densities). 13 January 2012. ERMS 556866. Carlsbad, NM: Sandia National Laboratories.* [PDF / Author]
Johnson, P.B. 2012c. Memo to Records Center (Subject: 2005 Calculated Densities). 23 January 2012. ERMS 556883. Carlsbad, NM: Sandia National Laboratories.* [PDF / Author]
Johnson, P.B. 2012d. Memo to Records Center (Subject: 2006 Calculated Densities). 30 January 2012. ERMS 556887. Carlsbad, NM: Sandia National Laboratories.* [PDF / Author]
Johnson, P.B. 2012e. Memo to Records Center (Subject: 2004 Calculated Densities). 9 May 2012. ERMS 557405. Carlsbad, NM: Sandia National Laboratories.* [PDF / Author]
Johnson, P.B. 2012f. Memo to Records Center (Subject: 2003 Calculated Densities). 9 May 2012. ERMS 557402. Carlsbad, NM: Sandia National Laboratories.* [PDF / Author]
Kuhlman, K.L. 2009a. Activity/Project Specific Procedure SP 9-9: Preparation of Culebra Potentiometric Surface Contour Maps. ERMS 552306. Carlsbad, NM: Sandia National Laboratories.* [PDF / Author]
Kuhlman, K.L. 2009b. Analysis Report for Preparation of 2008 Culebra Potentiometric Surface Contour Map. ERMS 552005. Carlsbad, NM: Sandia National Laboratories.* [PDF / Author]
Kuhlman, K.L. 2010a. Analysis Report AP-111 Revision 1, Culebra Water Level Monitoring Network Design. ERMS 554054. Carlsbad, NM: Sandia National Laboratories.* [PDF / Author]
Kuhlman, K.L. 2010b. Analysis Report for Preparation of 2009 Culebra Potentiometric Surface Contour Map. ERMS 553645. Carlsbad, NM: Sandia National Laboratories.* [PDF / Author]
Kuhlman, K.L. 2011. Analysis Report for Preparation of 2010 Culebra Potentiometric Surface Contour Map. ERMS 555318. Carlsbad, NM: Sandia National Laboratories.* [PDF / Author]
Kuhlman, K.L. 2012a. Analysis Report for Preparation of 2000-2004 Culebra Potentiometric Surface Contour Maps. ERMS 557660. Carlsbad, NM: Sandia National Laboratories.* [PDF / Author]
Kuhlman, K.L. 2012b. Analysis Report for Preparation of 2005-2007 Culebra Potentiometric Surface Contour Maps. ERMS 557494. Carlsbad, NM: Sandia National Laboratories.* [PDF / Author]
Kuhlman, K.L. 2012c. Analysis Report for Preparation of 2011 Culebra Potentiometric Surface Contour Map. ERMS 557633. Carlsbad, NM: Sandia National Laboratories.* [PDF / Author]
McKenna, S.A. 2004. Analysis Report: AP-111; Culebra Water Level Monitoring Network Design. AP-111. ERMS 540477. Carlsbad, NM: Sandia National Laboratories. [PDF / Author]
Powers, D.W. 2009. Basic Data Report for Drillhole SNL-16 (C-3220) (Waste Isolation Pilot Plant) (February). DOE/WIPP 07-3364. Carlsbad, NM: U.S. Department of Energy.* [PDF / Author]
Schuhen, M.D. 2010a. Test Plan TP 03-01: Test Plan for Testing of Wells at the WIPP Site, Revision 3. ERMS 553985. Carlsbad, NM: Sandia National Laboratories.* [PDF / Author]
Schuhen, M.D. 2010b. Test Plan TP 06-01: Monitoring Water Levels in WIPP Wells, Revision 3. ERMS 553993. Carlsbad, NM: Sandia National Laboratories.* [PDF / Author]
Schuhen, M.D. 2011. WIPP WGS-1 Laboratory Notebook, WIPP Geologic Samples. ERMS 555594. Carlsbad, NM: Sandia National Laboratories.* [PDF / Author]
Toll, N.J., and T.C. Rasmussen. 2007. "Removal of barometric pressure effects and earth tides from observed water levels," Ground Water, 45(1), 101-105. [Author]
U.S. Department of Energy (DOE). 2004. Waste Isolation Pilot Plant Environmental Monitoring Plan. DOE/WIPP 99-2194. Carlsbad, NM: U.S. Department of Energy. [Author]
U.S. Department of Energy (DOE). 2008. Waste Isolation Pilot Plant Annual Site Environmental Report for 2007. DOE/WIPP 08-2225. Carlsbad, NM: U.S. Department of Energy. [PDF / Author]
U.S. Department of Energy (DOE). 2009a. Basic Data Report for Well Plugging and Abandonment, Reconfiguration, and New Well Drilling Activities for Fiscal Year 2008. DOE/WIPP 08-3326. Carlsbad, NM: U.S. Department of Energy.* [PDF / Author]
U.S. Department of Energy (DOE). 2009b. Title 40 CFR Part 191 Subparts B and C Compliance Recertification Application for the Waste Isolation Pilot Plant. DOE/WIPP 2009-3424. Carlsbad, NM: US Department of Energy.* [Author]
U.S. Department of Energy (DOE). 2009c. Waste Isolation Pilot Plant Annual Site Environmental Report for 2008. DOE/WIPP 09-2225. Carlsbad, NM: U.S. Department of Energy.* [PDF / Author]
U.S. Department of Energy (DOE). 2010. Waste Isolation Pilot Plant Annual Site Environmental Report for 2009. DOE/WIPP 10-2225. Carlsbad, NM: U.S. Department of Energy.* [PDF / Author]
U.S. Department of Energy (DOE). 2011. Waste Isolation Pilot Plant Annual Site Environmental Report for 2010. DOE/WIPP 11-2225. Carlsbad, NM: U.S. Department of Energy.* [PDF / Author]
U.S. Department of Energy (DOE). 2012. Waste Isolation Pilot Plant Annual Site Environmental Report for 2011. DOE/WIPP 12-3489. Carlsbad, NM: U.S. Department of Energy.* [PDF / Author]
U.S. Environmental Protection Agency (EPA). 1996. "40 CFR Part 194: Criteria for the Certification and Recertification of the Waste Isolation Pilot Plant's Compliance with the 40 CFR Part 191 Disposal Regulations; Final Rule." Federal Register, vol. 61 (February 9, 1996): 5223-45. [PDF / Author]